

01Project home
Every project, with its summary
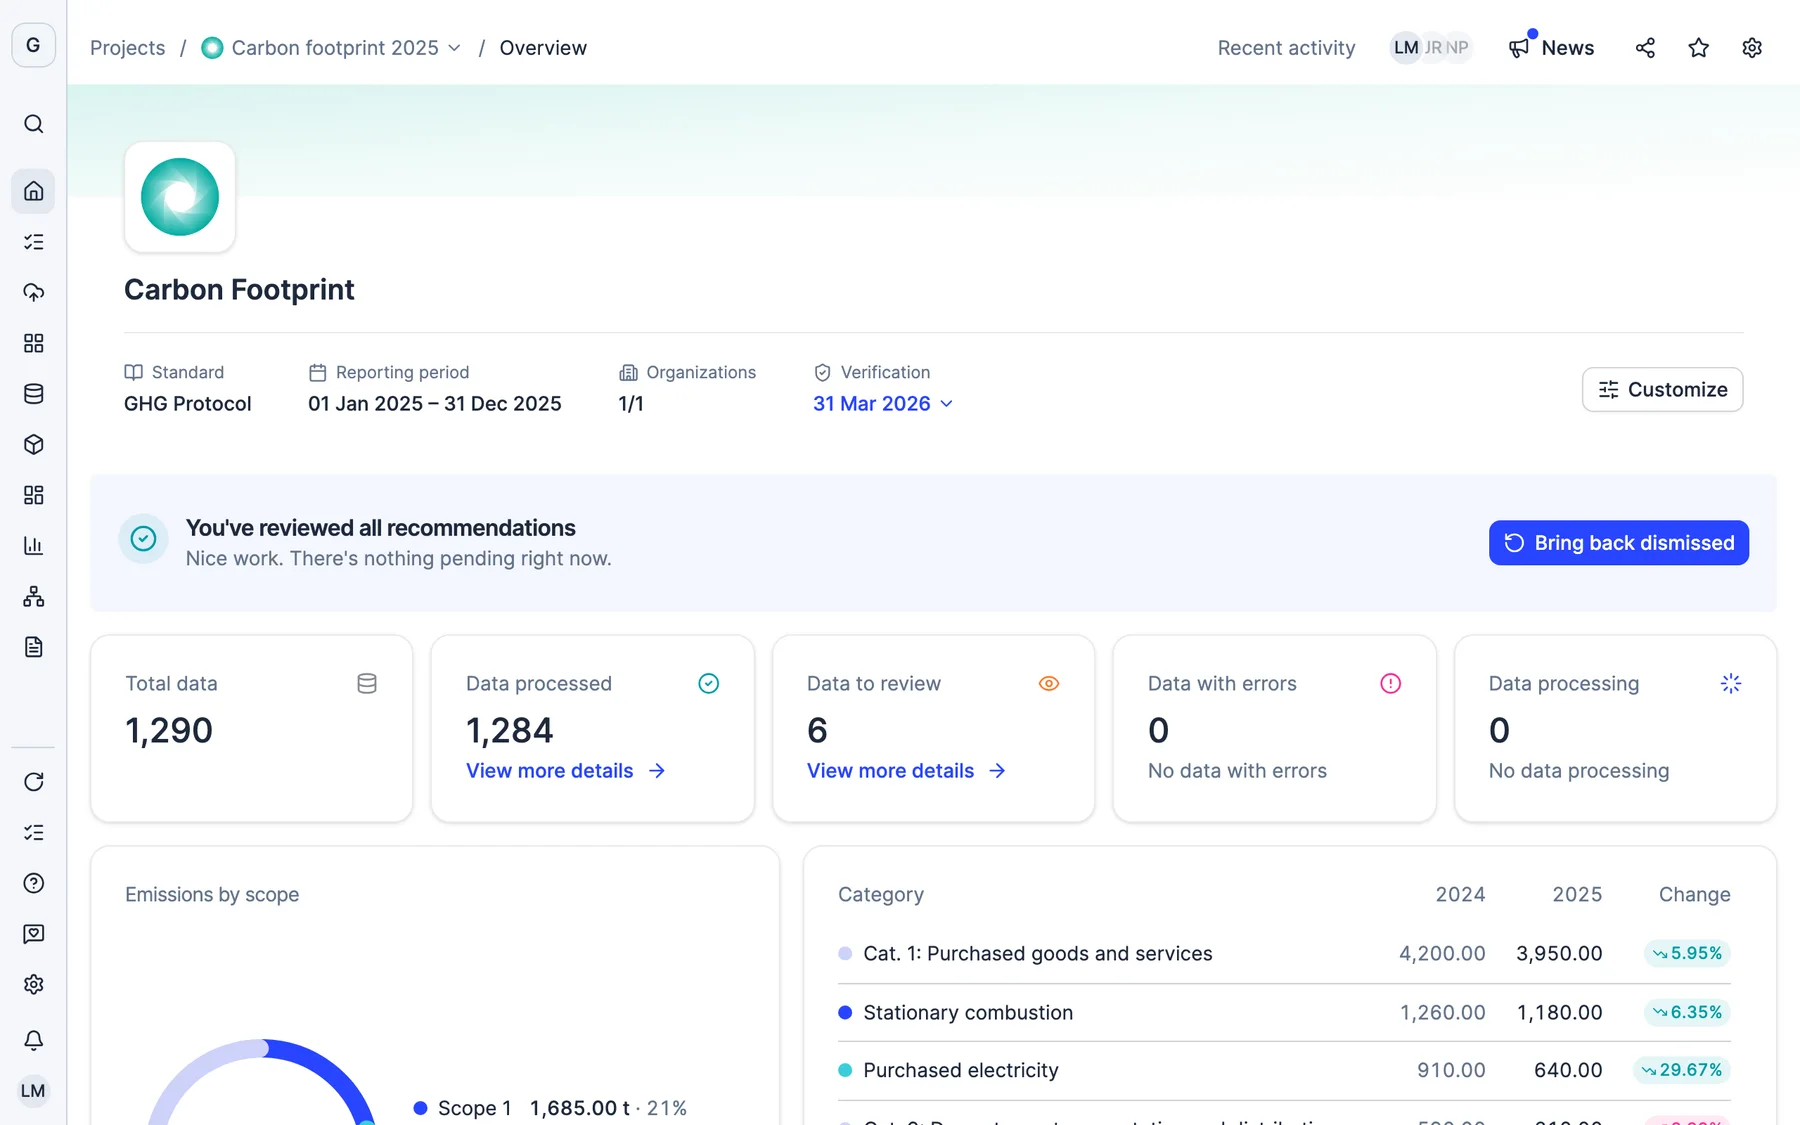
When you open a project you see how much data you have and how much is still to review, emissions by scope and each category compared with the previous year.
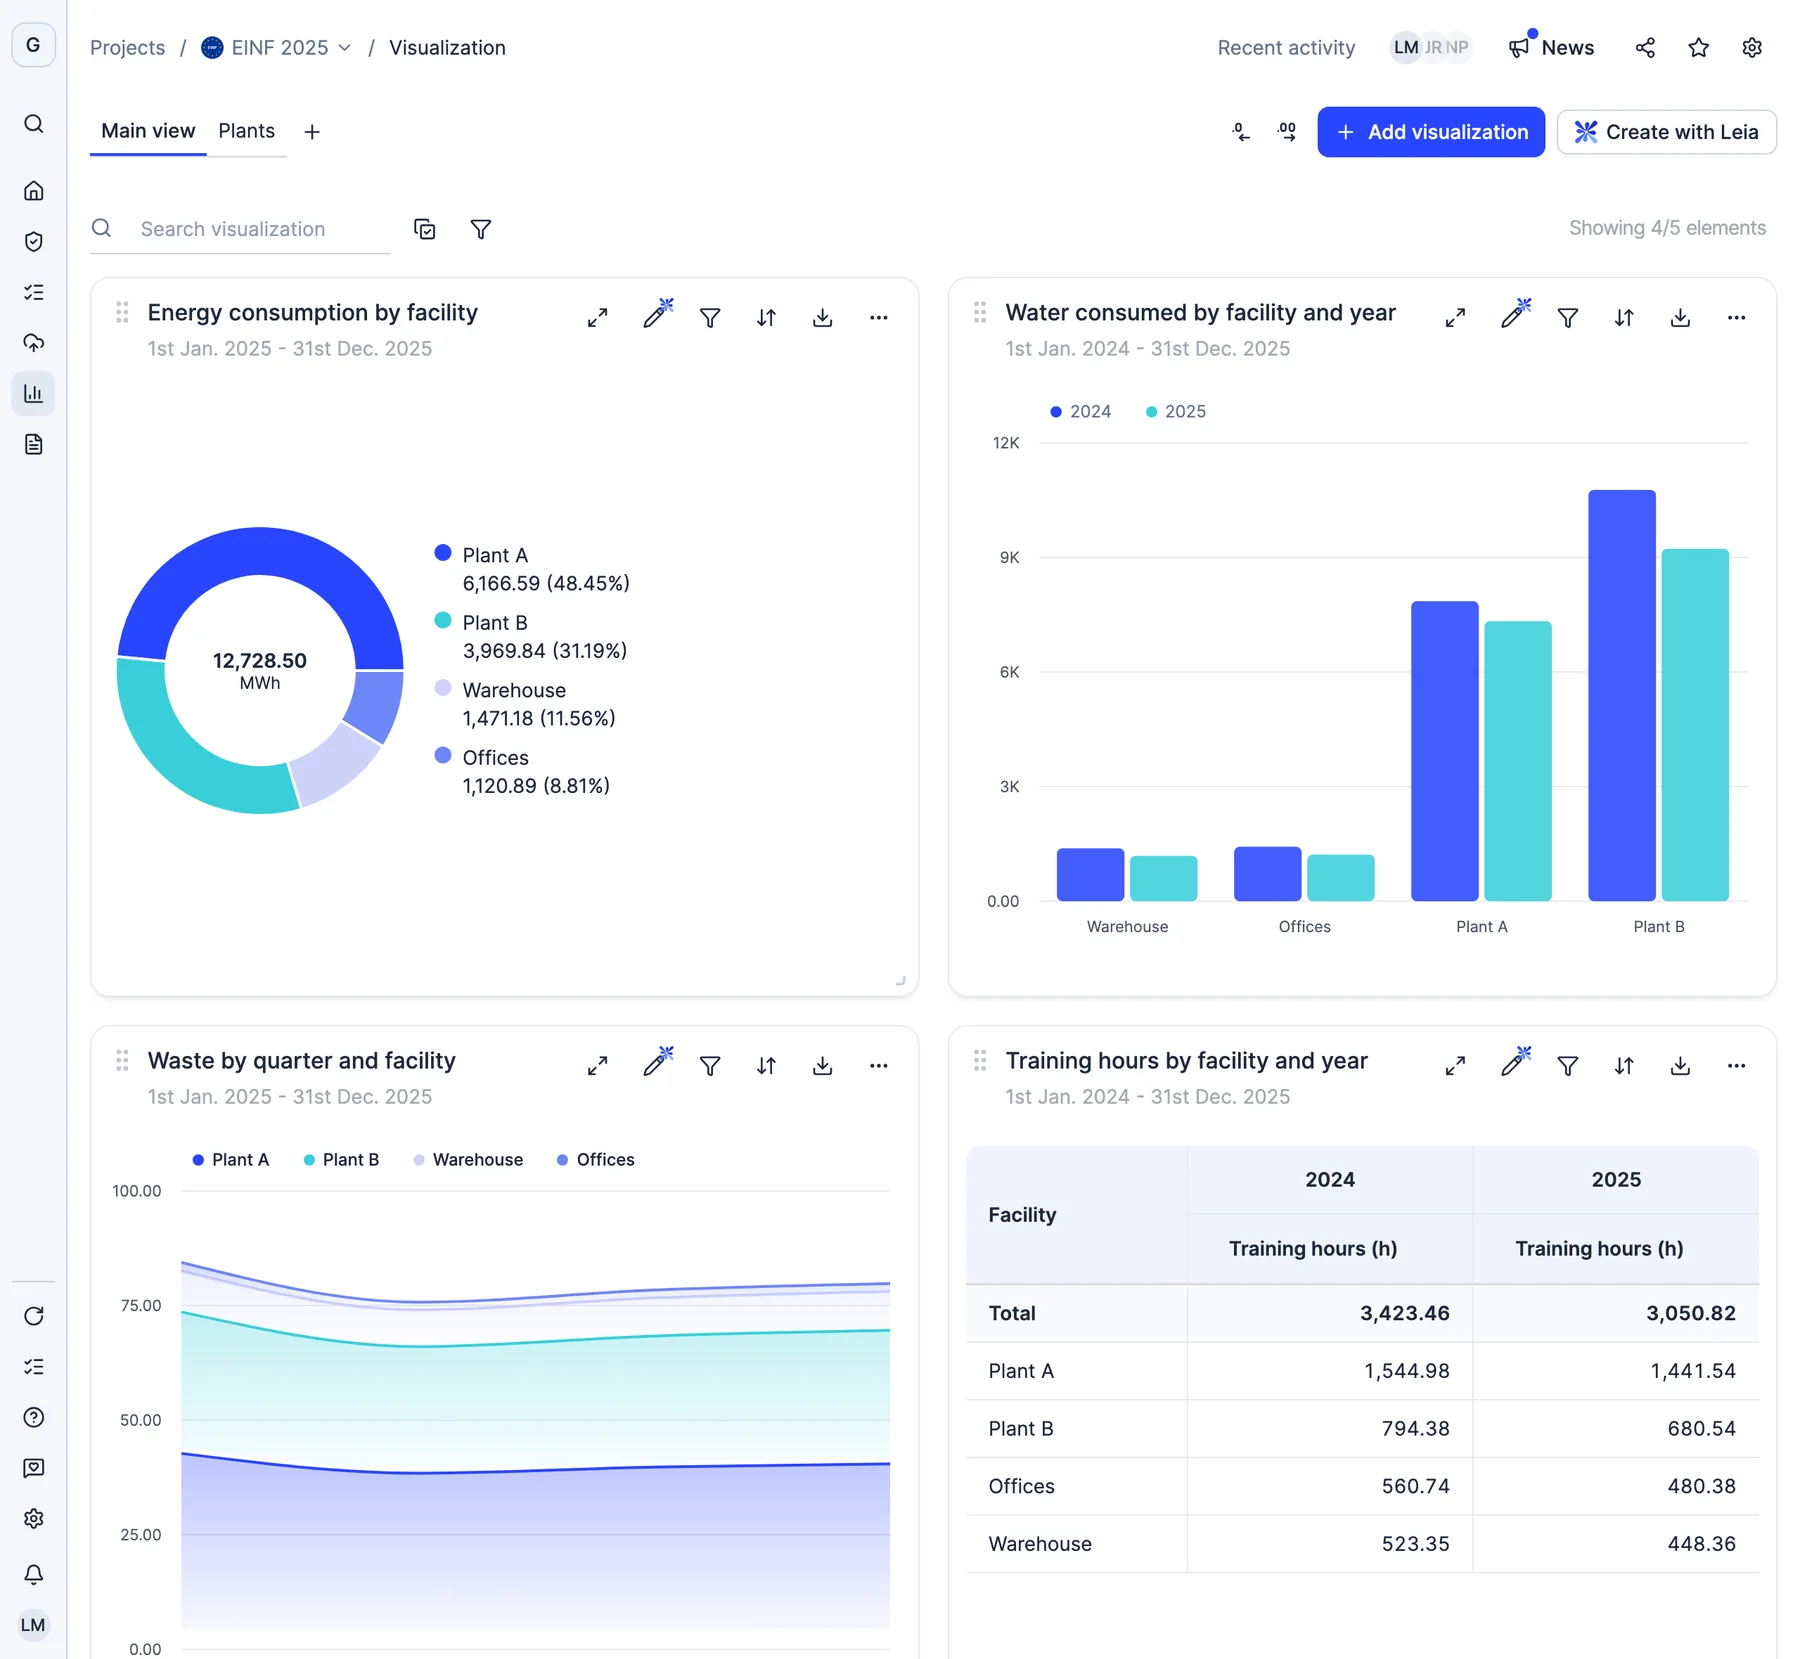
Energy, water, waste, workforce, purchases or your own categories: build the chart you need from any Dcycle data, cut it however you like or ask Leia to do it for you. Then add it to your report.
More than 2,000 European companies trust Dcycle






Energy, water, waste, workforce or your own categories: pick the data, break it down by facility, category or period and choose the chart. And if you would rather not touch a single filter, describe it to Leia.
Write what you need in your own words. Leia prepares the visualization, tells you what she assumed and you review it: nothing is saved until you click Save.
When you open a project you see how much data you have and how much is still to review, emissions by scope and each category compared with the previous year.
Organise your charts into views, filter a view by facility and duplicate it for each plant. Every chart downloads as an image or as data, or can be shared with a link.
Real Dcycle screens with a sample company.
Any data you have in Dcycle: energy, water, waste, workforce, training, accidents, purchases or emissions, your own categories, your custom KPI groups, and your facilities and vehicles.
In three steps: you choose the data source, shape it with rows, columns, values, filters and period, and pick the chart type from bars, lines, area, pie, table or single value.
Yes. With “Create with Leia” you describe what you want to see and Leia prepares the visualization, tells you what she assumed and you review it before saving.
Yes. You can compare periods in the same table or chart, and show any metric as a percentage of the row, the column or the total.
Yes. You can consolidate on an operational or financial basis and group by the group structure, so each parent includes its subsidiaries.
Yes. When you insert a chart into a report it stays linked to your data and updates by itself. You can also download it as an image or as data, or share it with a link.
Thirty minutes with our team. We show you how your data would come in, and what you would get out.
See Dcycle in actionWhat your session looks like



 With someone from the team who then supports you