



We know that waste reporting can be… a waste of time 😅.
That’s why we’ve built a dynamic pivot table that lets you cross-reference, filter, and visualize your waste management data with total flexibility.
Feel always ready with your data
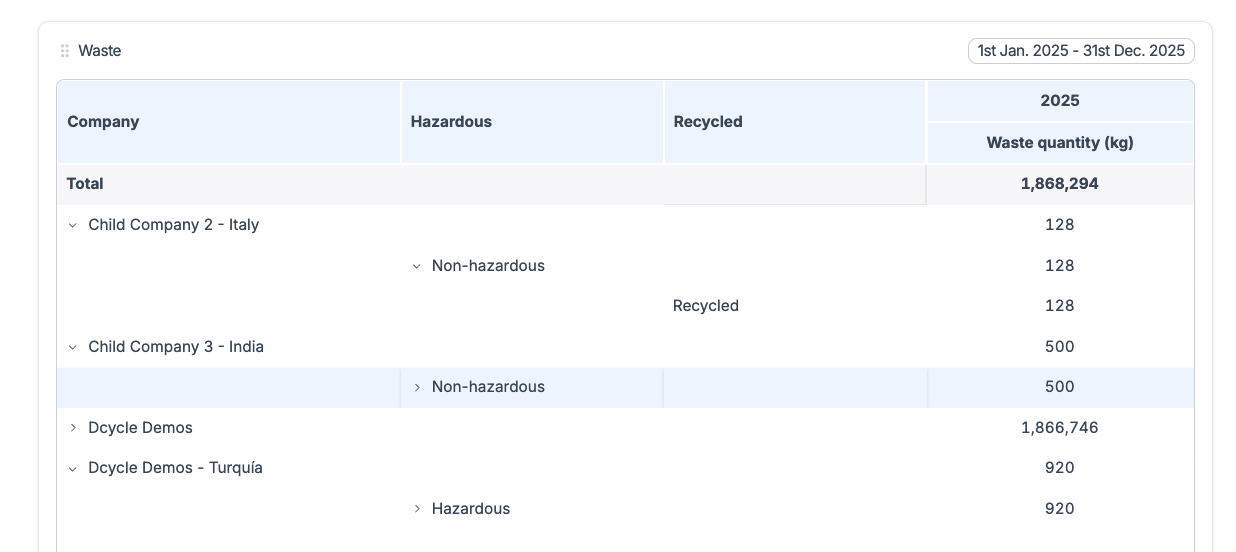
📈 Configure it once, exploit when you want 📥 What you see is what you get → Download to Excel exactly as shown in the table. 🤝 Share with zero friction → Send the file ready for audits or reports. ⚡ Always up to date → Connected to your records in real time.
Compliant with:
ISO 14001·CSRD·EcoVadis·Internal reporting
It’s already available in your account. Prepare the visualisation in your **project and share the results!. **What used to take hours is now just a couple of clicks. 🚀
Let us know how you get on, we’d love to hear your feedback so we can keep improving 🙂
Frequently asked questions (FAQs)
What waste data should companies organize to support ISO 14001 and sustainability reporting?
Organize waste streams, quantities, units, dates, facilities, treatment or disposal routes, contractors, hazardous-waste classifications, and supporting records. Linking each entry to its site and source makes it easier to monitor operational controls for ISO 14001, answer customer or EcoVadis requests, and reuse the same data in sustainability reporting.