


Energy, materials, water and waste records already exist across manufacturing sites, but they are often rebuilt for separate cost reviews, customer requests and environmental disclosures. Manufacturing sustainability statistics are useful when they establish the scale of those operational pressures without hiding the boundary behind a headline percentage.
Together, these 25 figures show how manufacturing output, emissions, energy use, materials, water, waste and efficiency are changing. The data comes from UNIDO, Eurostat, the European Environment Agency, the International Energy Agency, the US Department of Energy, the US Environmental Protection Agency and the World Bank. Each figure retains its source year, geography and measurement boundary so it can be cited accurately.
The evidence points to a practical conclusion. Manufacturing remains energy and emissions intensive, but verified plant programmes show that efficiency can produce material cost savings. The benchmark is only a starting point. Companies still need site, process and production data to decide where action will generate the greatest operational and financial result.
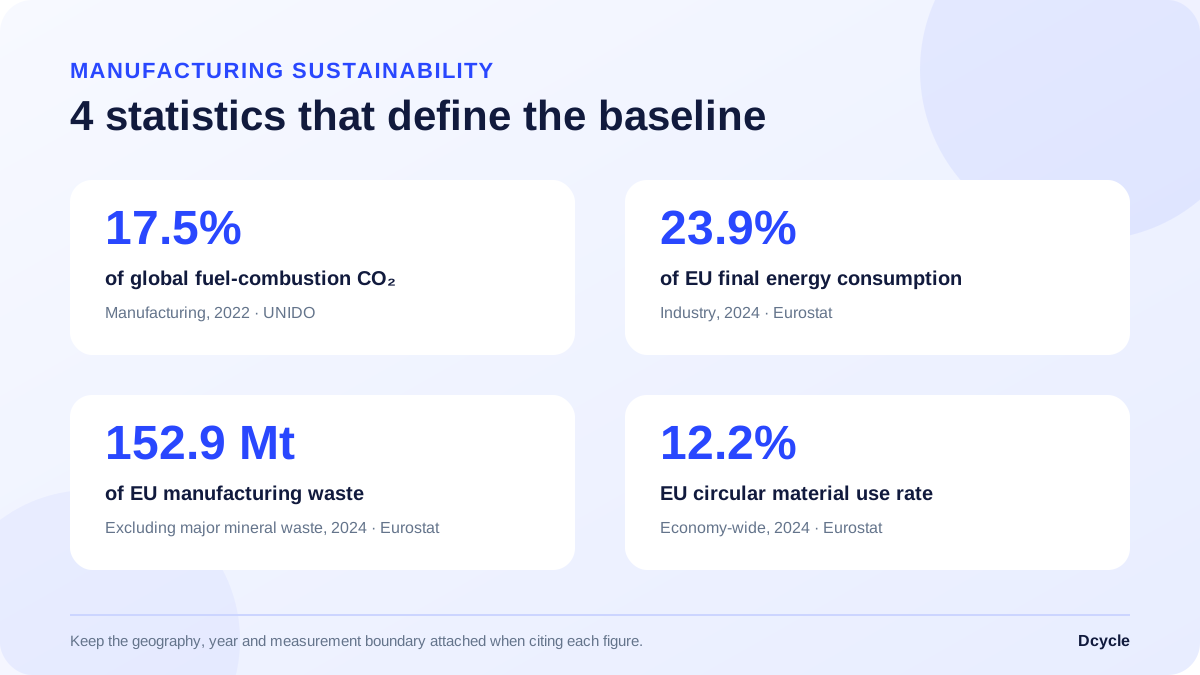
25 manufacturing sustainability statistics at a glance
These 6 headline figures show the range of the evidence. They should not be added together because they measure different geographies, periods and system boundaries.
| Finding | Measurement boundary | Primary source |
|---|---|---|
| Manufacturing produced about 17.5% of global CO2 from fuel combustion | Global manufacturing, 2022 | UNIDO Industrial Statistics Yearbook 2025 |
| EU industry used 8,835 PJ of final energy | EU industry, 2024 | Eurostat energy use in industry |
| EU industrial emissions were 39% below 2005 | EU industry in the European Climate Law scope, 2025 estimate | EEA Trends and Projections 2026 |
| EU manufacturing generated 152.9 million tonnes of waste | Waste excluding major mineral waste, 2024 | Eurostat waste statistics |
| EU circular material use reached 12.2% | Economy-wide material use, 2024 | Eurostat circular material use |
| US Better Buildings and Better Plants partners saved $24.2 billion | Cumulative programme results since 2011 | US DOE 2025 Progress Update |
Citation tip: Keep the sector label attached to the number. Manufacturing, industry and the total economy are not interchangeable statistical populations.
How these manufacturing statistics were selected
The dataset prioritises primary statistical agencies and public bodies. The newest release date is not always the same as the data year: a 2026 publication can contain verified 2024 or 2025 observations. This article therefore states both where necessary.
Manufacturing-only figures use the source’s manufacturing classification. Wider industrial figures are explicitly labelled as industry. Programme results from the US DOE and EPA describe participating organisations, not the average performance of every factory. Global water-reuse figures include municipal and industrial systems and are presented as context rather than a manufacturing-only benchmark.
No values have been combined into a synthetic total. Currency amounts remain in the source currency, energy is reported in petajoules or British thermal units as published, and percentage changes retain their original base years. This is the same discipline required when comparing a company’s manufacturing carbon footprint with an external sector benchmark.
25 manufacturing sustainability statistics for 2026
The numbered sequence below covers output, emissions, energy, waste, circular materials, water and verified efficiency results. Every item explains what the number does and does not measure.
1. Global manufacturing output expanded by 2.9%
Global manufacturing expanded by 2.9% in 2024, according to the UNIDO International Yearbook of Industrial Statistics 2025. Middle-income economies led the growth, strengthening their role in global value chains.
Output growth matters because absolute energy and material demand can rise even when impact per unit improves. A company should therefore monitor both total consumption and intensity per tonne, unit or euro of production.
2. Manufacturing produced about 17.5% of global fuel-combustion CO2
UNIDO estimates that manufacturing accounted for approximately 17.5% of global CO2 emissions from fuel combustion in 2022. The corresponding volume was around 6.0 gigatonnes of CO2.
This boundary covers fuel combustion and does not represent every manufacturing greenhouse gas. Process emissions from activities such as cement production and emissions elsewhere in the value chain require separate treatment.
3. Manufacturing emitted around 6.0 gigatonnes of CO2 from fuel combustion
The 6.0 gigatonne estimate gives scale to the 17.5% share. It is larger than the total territorial emissions of most countries, but it should not be added to separate sector shares unless their accounting boundaries are compatible.
For company decisions, the useful next level is a source register covering stationary fuel, purchased electricity, process emissions and relevant value-chain activities. ISO 50001 provides a structured route for managing significant energy uses, while a greenhouse gas inventory connects energy with other emission sources.
4. EU industry represented 19% of covered greenhouse gas emissions
Industry accounted for 19% of EU greenhouse gas emissions in 2025 within the scope assessed by the European Environment Agency. The category is broader than manufacturing alone.
The share shows why industrial decarbonisation remains central to European climate targets. It does not indicate which factory, process or product has the highest reduction potential.
5. EU industrial emissions fell by 2.6% in 1 year
The EEA estimates that EU industrial greenhouse gas emissions declined by 2.6% between 2024 and 2025. A 1-year movement may reflect production, fuel switching, efficiency, technology and wider economic conditions.
Manufacturers should avoid attributing an annual reduction to a project without adjusting for output and operating conditions. Absolute emissions and production-normalised intensity answer different management questions.
6. EU industrial emissions were 39% below 2005
By 2025, EU industrial emissions were estimated to be 39% below their 2005 level. This longer trend is less sensitive to a single business cycle than the annual change.
The EEA also notes that industry has increased economic value while reducing emissions over the longer term. That supports the possibility of decoupling, but the result varies by subsector and cannot be used as a plant-level target without additional analysis.
7. EU manufacturing emissions fell by 18% from 2013 to 2024
Eurostat reports that manufacturing greenhouse gas emissions fell by 18% between 2013 and 2024, equivalent to a reduction of 146 million tonnes of CO2 equivalent. The data come from EU air emissions accounts, which allocate emissions to economic activities.
This statistical boundary differs from territorial inventories. When citing the result, retain both the 2013 base year and the manufacturing classification.
8. Global industrial-process CO2 declined by about 2% in 2025
CO2 emissions from industrial processes declined by approximately 2%, or 40 million tonnes, in 2025, according to the IEA Global Energy Review 2026. These are process emissions rather than the complete industrial footprint.
Process emissions need specific activity data. A cement kiln, chemical reaction and refrigerant loss require different factors and controls from purchased electricity or boiler fuel.
9. EU industry used 8,835 petajoules of final energy
EU industry consumed 8,835 petajoules of final energy in 2024, Eurostat reports. This was 8.1% lower than in 2014.
Final energy is the energy delivered to end users, not the primary energy required across the entire supply system. Plant teams should keep the source unit, conversion and meter boundary visible when comparing their data with this benchmark.
10. Industry represented 23.9% of EU final energy consumption
Industry accounted for 23.9% of total EU final energy consumption in 2024. This economy-wide share confirms that industrial operations remain a major demand centre.
For a manufacturer, the share does not reveal the important uses inside the site. Process heat, compressed air, motors, refrigeration and buildings need separate baselines to identify avoidable cost.
11. Electricity supplied 33.3% of EU industrial final energy
Electricity was the largest energy carrier used by EU industry in 2024 at 2,945 petajoules, or 33.3% of final energy consumption. Electrification can reduce direct combustion emissions, but the result depends on the electricity mix, equipment efficiency and operating profile.
Energy invoices and interval data should be linked with production and equipment records. This allows teams to distinguish a tariff effect from a real improvement in physical performance.
12. Natural gas supplied 31.9% of EU industrial final energy
Natural gas provided 2,817 petajoules, or 31.9%, of EU industrial final energy in 2024. Electricity and gas together represented almost 2 thirds of the industrial energy mix.
Gas dependence is especially relevant for heat-intensive processes. A transition plan needs temperature requirements, asset life, production constraints and local infrastructure, not only an annual consumption total.
13. Renewables and biofuels supplied 11.3% of EU industrial energy
Renewable energy and biofuels supplied 999 petajoules, or 11.3%, of EU industrial final energy in 2024. Their consumption was 24.3% higher than in 2014.
The category combines different sources and sustainability characteristics. Procurement records should retain the carrier, supplier evidence, period and calculation method instead of storing only an aggregated renewable percentage.
14. Industrial use of solid fossil fuels fell by 34.8%
EU industrial consumption of solid fossil fuels fell by 34.8% between 2014 and 2024. Heat supplied to industry declined by 23.7% over the same period, while non-renewable waste consumption rose by 32.1%.
These changes demonstrate why a single energy total can hide important substitutions. Cost, emissions and operational risk need to be assessed by carrier and use.
15. Manufacturing used 25.5% of EU net domestic energy
Manufacturing represented 25.5% of EU net domestic energy use in 2023, according to Eurostat energy accounts. Net domestic energy use is an environmental-economic accounting measure and is not identical to final energy consumption.
The distinction is valuable for researchers. It is also a warning against placing 25.5% and 23.9% side by side without explaining that the denominators and accounting frameworks differ.
16. EU manufacturing generated 152.9 million tonnes of waste
Manufacturing activities generated 152.9 million tonnes of waste excluding major mineral waste in 2024. That was about 20% of the EU total under the same exclusion.
Waste data should connect material, weight, site, treatment route and contractor evidence. Financial teams can then relate disposal cost and material loss to the physical record instead of treating waste as a single annual line item.
17. Manufacturing waste fell by 36.2% over 20 years
EU manufacturing waste excluding major mineral waste declined from 239.9 million tonnes in 2004 to 152.9 million tonnes in 2024, a 36.2% reduction.
The trend is substantial, but it does not prove equivalent progress in every subsector or company. Changes in production structure, classification and offshoring can affect aggregate results alongside prevention and efficiency.
18. The EU circular material use rate reached 12.2%
Recycled materials accounted for 12.2% of total material use in the EU in 2024, up 0.1 percentage points in 1 year and 1.0 point since 2015. This is an economy-wide circularity indicator, not a manufacturing recycling rate.
Manufacturers can influence it through secondary inputs, product design, scrap recovery and procurement. Internal indicators should distinguish recycled input content from waste recycling at the end of a process.
19. Circular use reached 23.4% for metal ores
The EU circular material use rate varied sharply by material in 2024: 23.4% for metal ores, 14.3% for non-metallic minerals, 9.9% for biomass and 3.8% for fossil energy materials.
This variation makes a single corporate circularity percentage difficult to interpret. A material-level view is more actionable for purchasing, engineering and product teams.
20. The EU material footprint reached 14.3 tonnes per person
The EU material footprint was estimated at 14.3 tonnes per person in 2025, or approximately 6.5 billion tonnes in total, according to Eurostat. The footprint includes raw materials required along supply chains for EU final demand.
Manufacturers should not use the per-person value as a company benchmark. Its relevance is that production decisions affect material demand beyond the mass purchased directly at the factory gate.
21. Global water-reuse capacity has tripled in 20 years
Global water-reuse capacity has tripled over the past 20 years and is expanding by almost 7% annually, according to the World Bank. The dataset covers reuse applications beyond manufacturing.
For industrial sites in water-stressed locations, reuse can reduce freshwater dependence and discharge volumes. Feasibility depends on water quality, treatment requirements, energy demand, permits and local economics.
22. Municipal and industrial water reuse is about 53 million cubic metres per day
Current municipal and industrial wastewater reuse is approximately 53 million cubic metres per day, yet this represents only 3% of freshwater withdrawals by those sectors in the World Bank’s assessment.
The gap shows both potential and constraint. A site water balance should track withdrawal source, process use, discharge, treatment and reuse before setting a target.
23. US programme partners saved $24.2 billion
Since 2011, more than 650 partners in the US DOE Better Buildings and Better Plants initiative have collectively reported $24.2 billion in cost savings. The programme spans manufacturers and several non-manufacturing organisations, so it is evidence from participants rather than a universal plant average.
The same partners reported 3.9 quadrillion British thermal units of energy saved. These results show why energy data should be linked with cost and project records, not managed only as a disclosure metric.
24. Programme partners saved 25 billion gallons of water
The DOE initiative reports 25 billion gallons of water saved and 4.4 million tonnes of waste diverted since 2011. The figures combine results across the participating portfolio.
Water and waste projects need their own baselines, but both benefit from the same governance: defined boundaries, responsible owners, source evidence and comparable periods.
25. Certified US industrial plants avoided $8.5 billion in energy costs
Since 2006, nearly 275 industrial plants have earned US EPA ENERGY STAR certification and collectively avoided more than $8.5 billion in energy costs, 1.3 quadrillion British thermal units of energy and 85 million tonnes of emissions. The EPA facts and statistics describe certified plants, not all US manufacturing facilities.
ENERGY STAR plant indicators use actual energy and production data. A score of 50 represents median performance within a comparable plant group, while 75 or higher can support certification eligibility after verification.
How manufacturers should use these benchmarks
Start with the boundary. Confirm whether the source measures manufacturing, all industry or the total economy; whether it covers direct emissions, fuel combustion or supply chains; and whether the figure is a total, share, intensity or change.
Then select a denominator that reflects the decision. Total energy and emissions show absolute exposure. Energy per unit, emissions per tonne and waste per production batch help operations compare performance. Cost per unit and avoided cost connect environmental performance with finance.
Finally, document the comparison. Preserve the source, version, data year, geography and calculation notes. A useful benchmark register prevents an old figure from being copied into a board deck after its boundary or source has been forgotten.
For energy-intensive sites, an energy audit can convert a high-level benchmark into a prioritised opportunity list. For recurring management, ISO 50001 connects significant energy uses, objectives and performance review.
How Dcycle connects manufacturing data with operational decisions
Manufacturers already generate environmental data through utility invoices, meters, ERP systems, production files, waste records, purchasing and supplier evidence. Today, many teams rebuild that information for a cost review, carbon footprint, customer questionnaire, audit and report.
Dcycle is an environmental data platform that structures the information once so operations, finance, auditors and reporting teams can reuse it. Reporting is 1 output. The same governed data can support cost control, process comparison, project prioritisation and supplier engagement.
Build a consistent site and process data model
Automated data collection brings supported invoices, spreadsheets and system exports into a controlled workflow. Records can be mapped to the correct facility, period, activity, unit and organisational boundary.
That structure matters in manufacturing because a total can move for many reasons. A higher electricity bill may reflect price, production, weather, equipment performance or a missing meter. Keeping the physical and contextual fields together makes investigation faster.
Compare performance without losing production context
Dcycle’s analytics capabilities help teams compare sites, periods and indicators from the governed dataset. Manufacturers can retain both absolute results and relevant intensity denominators.
This supports questions such as which line has the highest energy per unit, whether waste rose faster than production, or whether a water project delivered the expected change. The platform provides the data foundation; operational teams retain responsibility for interpreting process conditions and acting on the result.
Keep factors, evidence and revisions traceable
Evidence and traceability connect reported values with source files and processing history. If a meter value, waste ticket or emissions factor changes, teams can identify the affected calculation instead of replacing an unexplained number in a spreadsheet.
This traceability supports internal review and external assurance. It also reduces the effort needed to answer customer requests because the supporting record remains linked to the approved figure.
Reuse environmental data across outputs
Roles and permissions help define who provides, reviews and approves information. The same approved electricity record can support an energy-cost analysis, Scope 2 calculation, ISO 50001 review and customer disclosure without creating 4 uncontrolled copies.
Manufacturers still need to apply the correct methodology to each output. Reuse means preserving a trusted source layer, not pretending that every framework asks the same question.
Move from sector averages to investable actions
Sector statistics establish scale, but capital decisions need company evidence. Dcycle helps teams connect activity data, organisational context, calculations and supporting files so a proposed project can start from a defensible baseline.
Finance can review cost and expected savings, operations can monitor the physical change, and environmental teams can update emissions or resource indicators from the same records. That makes follow-up repeatable after the initial approval.
Manufacturing performance depends on reusable data
The 25 statistics show 2 realities at the same time. Manufacturing remains a major user of energy and materials, with substantial emissions and waste. It has also delivered long-term reductions, and verified plant programmes demonstrate that efficiency can create large cumulative savings.
The most useful benchmark is not the largest percentage. It is the figure whose boundary matches the decision. A plant manager needs process and production context, finance needs cost and return, and auditors need evidence. None can work reliably from an isolated sector average.
Manufacturers that structure environmental data once can compare sites, find losses, monitor projects and support multiple reporting requests without rebuilding the same baseline. That is how a statistics article becomes operational: the external number frames the opportunity, while governed company data determines what to do next.
Connect energy, materials, water, waste, production and evidence in 1 governed manufacturing data workflow.
See Dcycle in actionFrequently Asked Questions (FAQs)
What percentage of global emissions comes from manufacturing?
UNIDO estimates that manufacturing produced about 17.5% of global CO2 emissions from fuel combustion in 2022, equal to around 6.0 gigatonnes. This does not include every process emission or all value-chain greenhouse gases, so it should not be presented as manufacturing's complete climate footprint.
How much energy does industry use in the EU?
EU industry used 8,835 petajoules of final energy in 2024, representing 23.9% of EU final energy consumption. Electricity supplied 33.3% and natural gas 31.9% of industrial final energy.
How much waste does EU manufacturing generate?
EU manufacturing generated 152.9 million tonnes of waste excluding major mineral waste in 2024. This was 36.2% below the 239.9 million tonnes recorded in 2004.
Are industry and manufacturing statistics the same?
No. Industry can include manufacturing, mining, energy supply and other activities depending on the source. A reliable citation retains the source's exact sector classification and does not relabel an industry total as manufacturing.
What sustainability metrics should manufacturers track?
Useful metrics include absolute and production-normalised energy, emissions, water withdrawal, water reuse, material input, waste generation, recycling route and cost. The right denominator depends on the process and decision.
Can manufacturers use sector averages as company targets?
Sector averages are screening benchmarks, not automatic targets. Technology, product mix, capacity utilisation, geography and accounting boundaries vary. Companies should establish their own baseline and use external statistics to frame questions or check plausibility.
How does Dcycle support manufacturing sustainability data?
Dcycle structures environmental data from invoices, meters, spreadsheets and supported systems so operations, finance, auditors and reporting teams can reuse a governed source layer. It supports analysis, traceability and multiple outputs, but the company remains responsible for operational decisions and methodology choices.