What’s new in the EINF project
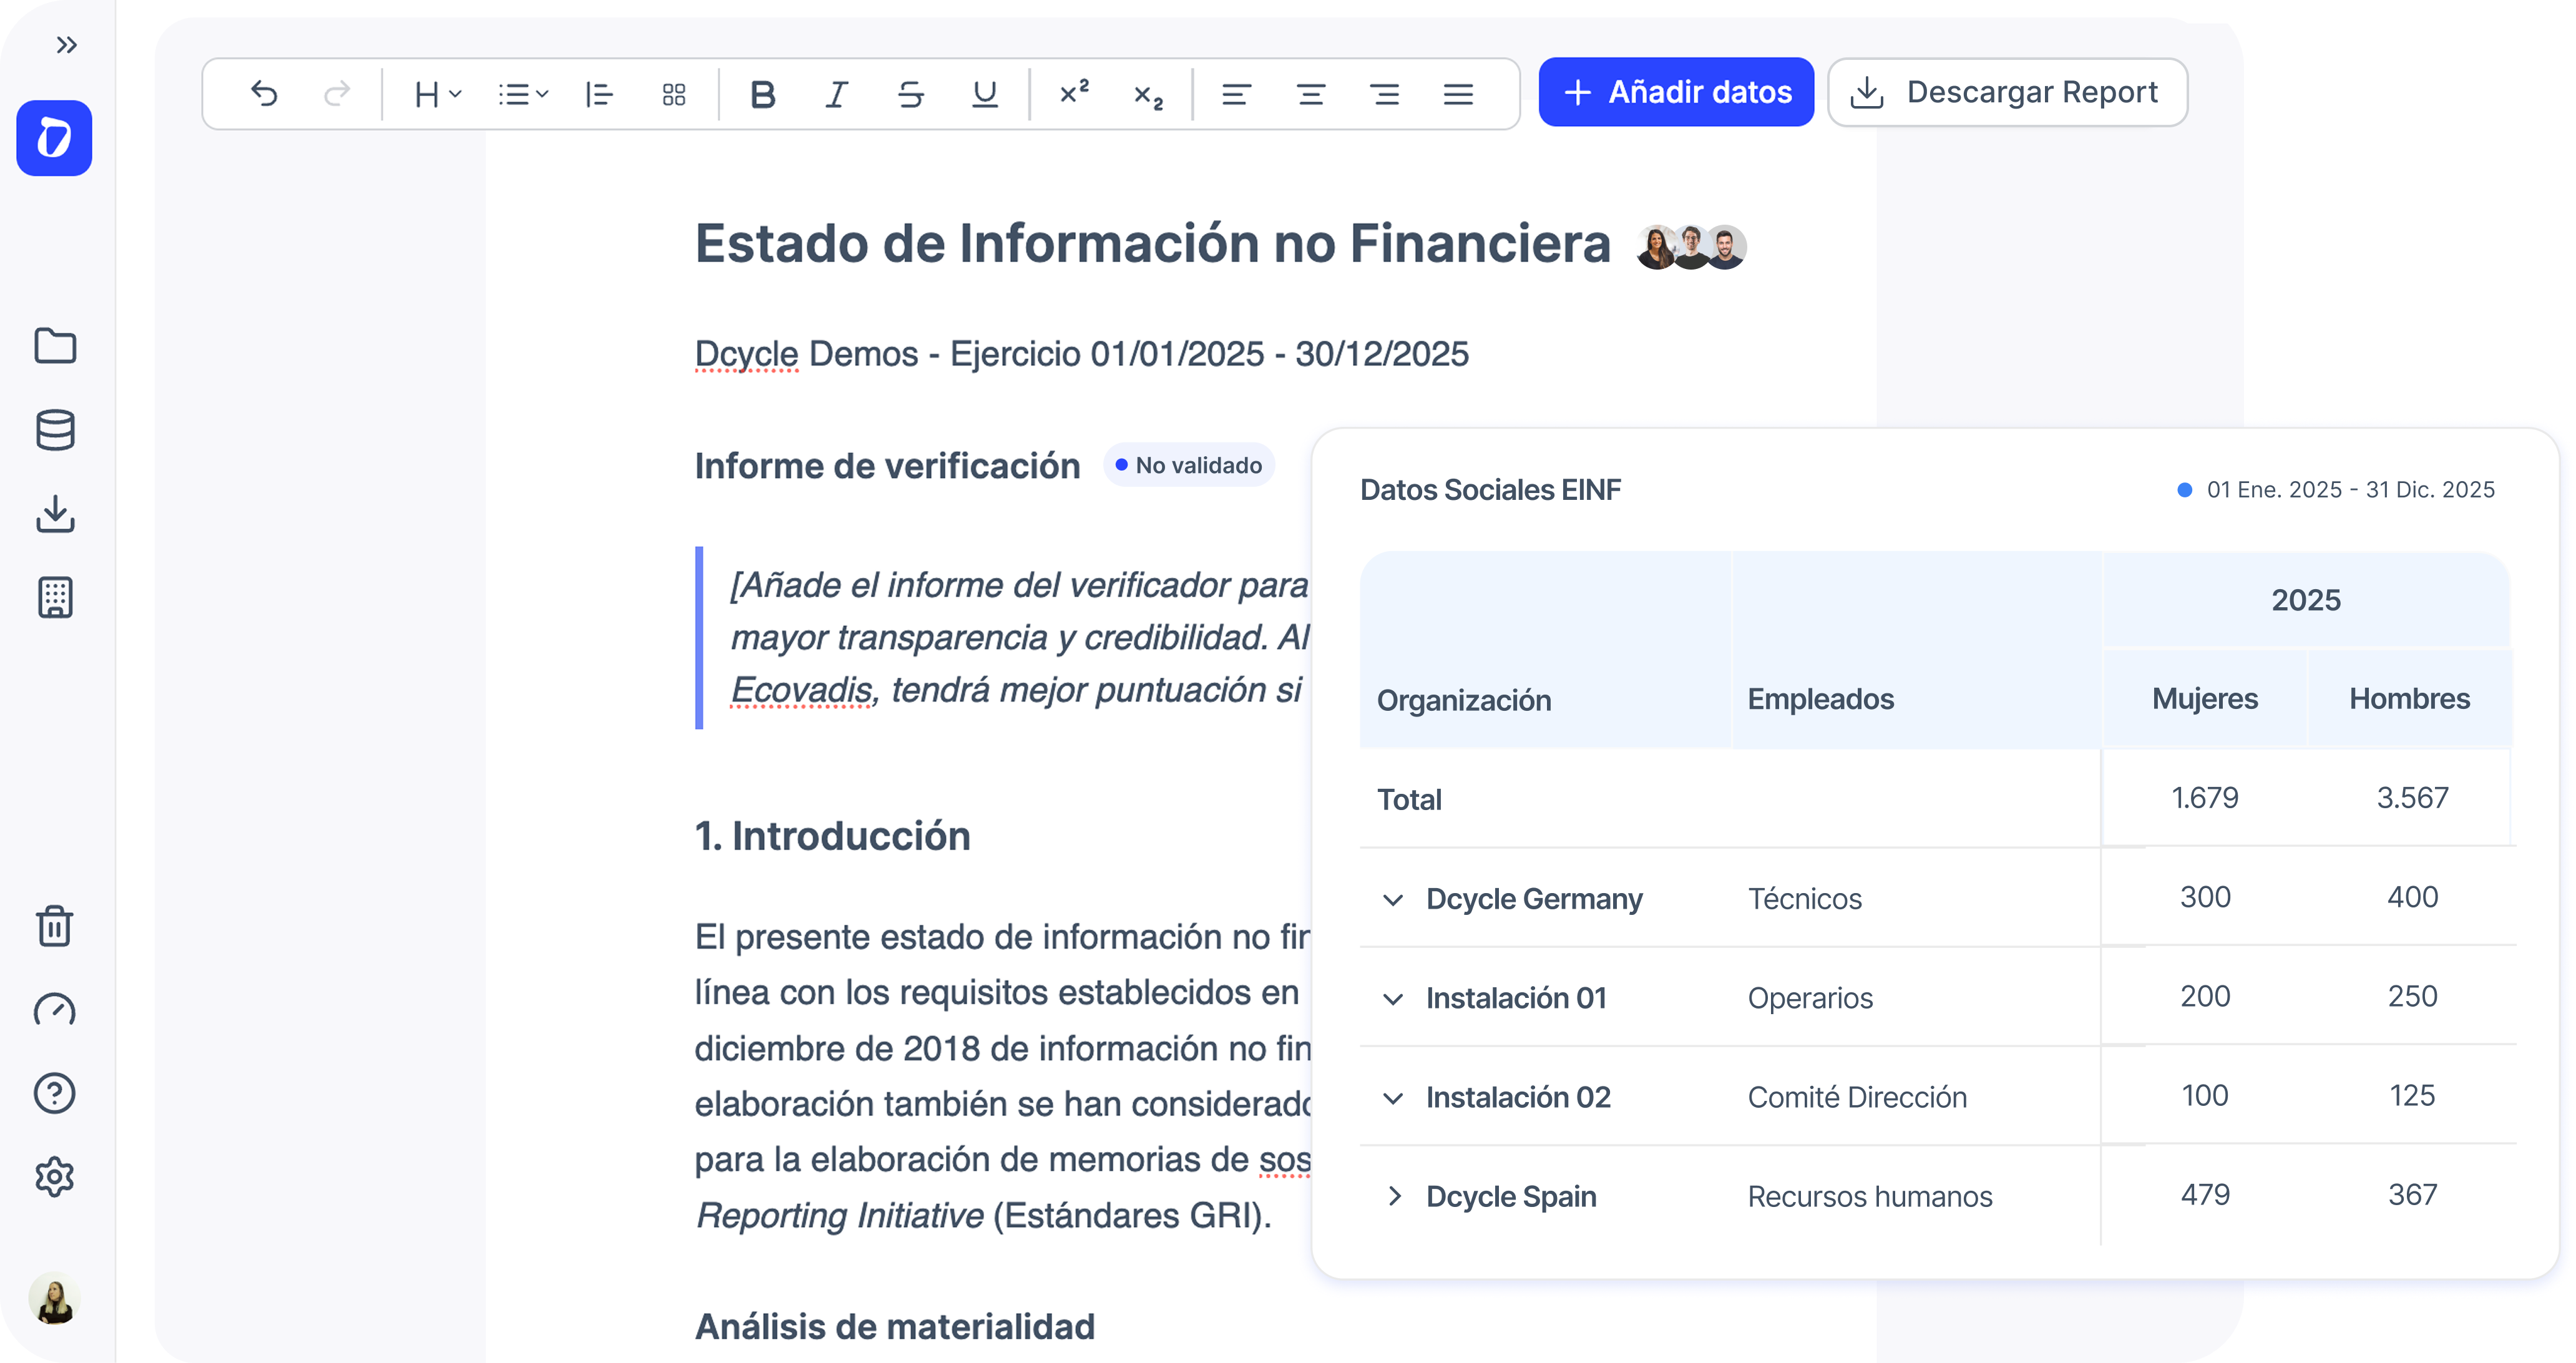
➡️ Visualisations are shown in the report once they are linked to a Data to report item.
➡️ In the Data to report section you can now:
- Decide which sections are included in the report
- Add text responses
- Add any visualisation from the same project
- Add evidence for future verification This way, you can build your report with full flexibility.
What will you get with this?
With this improvement, any KPI that can be generated in Project Visualisations can now be included in your EINF reports.
Every time a data point is updated, the correct result will be automatically reflected in the report — no manual updates needed.
Where will you see it?
1️⃣ First, create your visualisations in Project → Visualisations.
2️⃣ Then, link them to the reporting requirements in Project → Data to report and add a text response explaining the table.
3️⃣ Finally, find your responses in Project → Report.
Both when creating and editing any of your organisation’s vehicles.
Tip
Take advantage of the default visualisations created when setting up a new EINF project — these are the ones required for verification.
You can find them when creating a new project or via the new “Add template” button in Project → Visualisations or from the template library.