+2000 empresas confían en nosotros:

One workspace for all your non-financial data
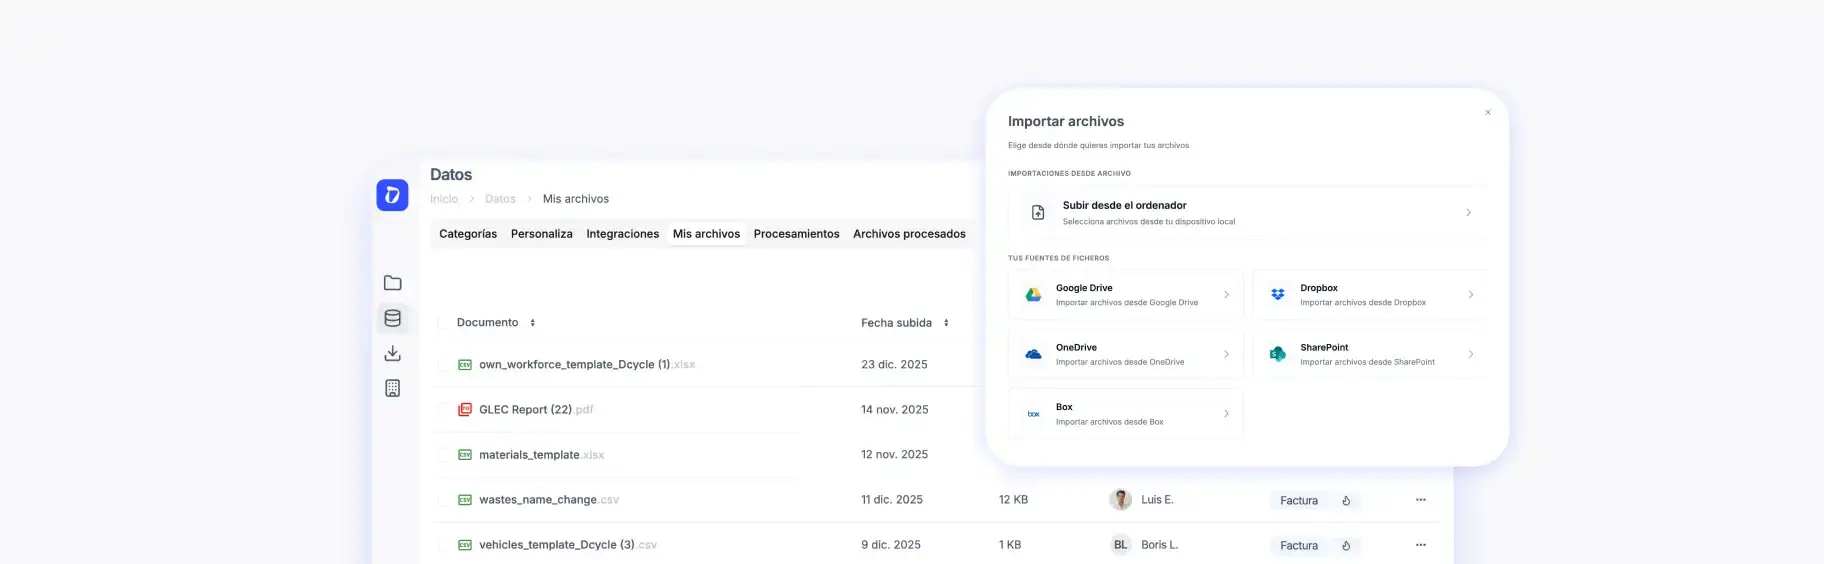
Manage ESG reporting, custom sustainability projects, and all your non-financial data from a single, intelligent platform.
Welcome to your project workspace
Get started in minutes with pre-built templates
Recommended templates
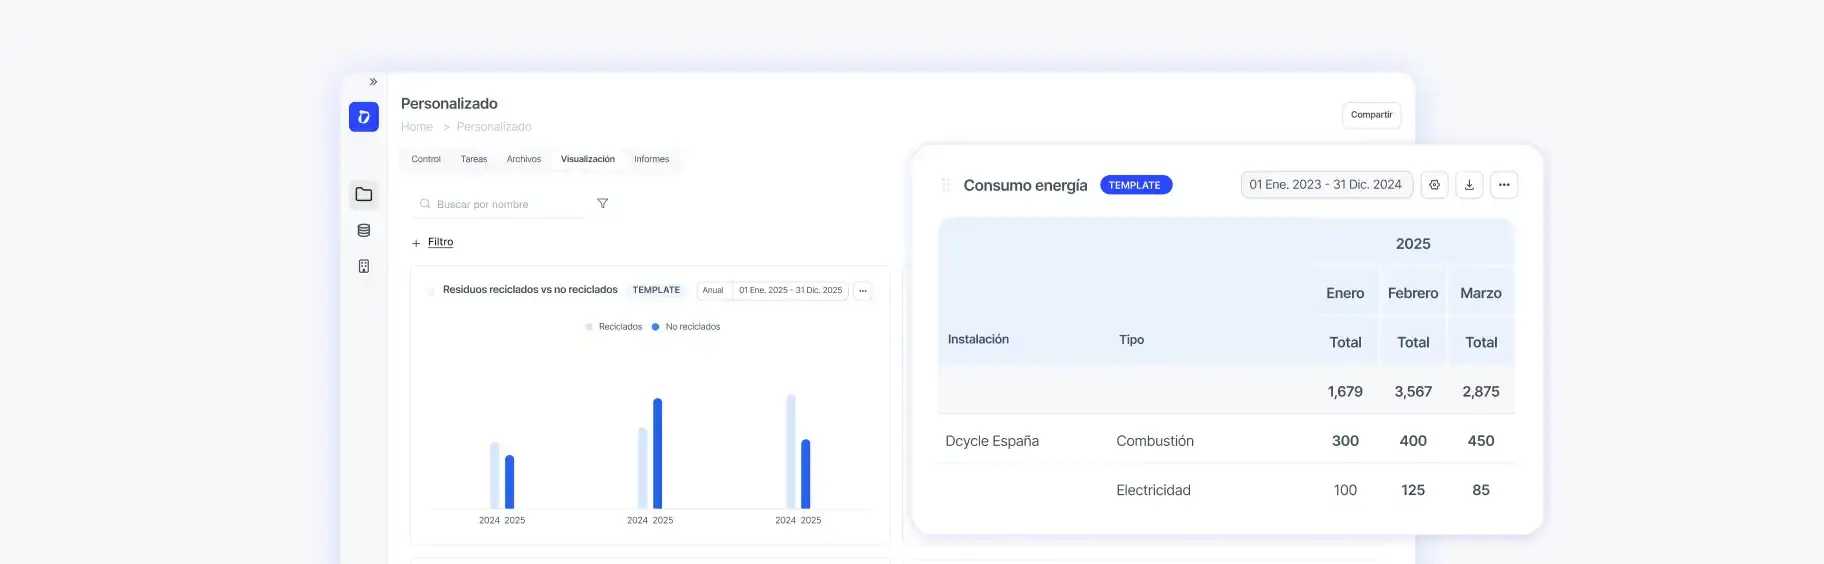
Custom
Ecovadis
Tracking, management & download
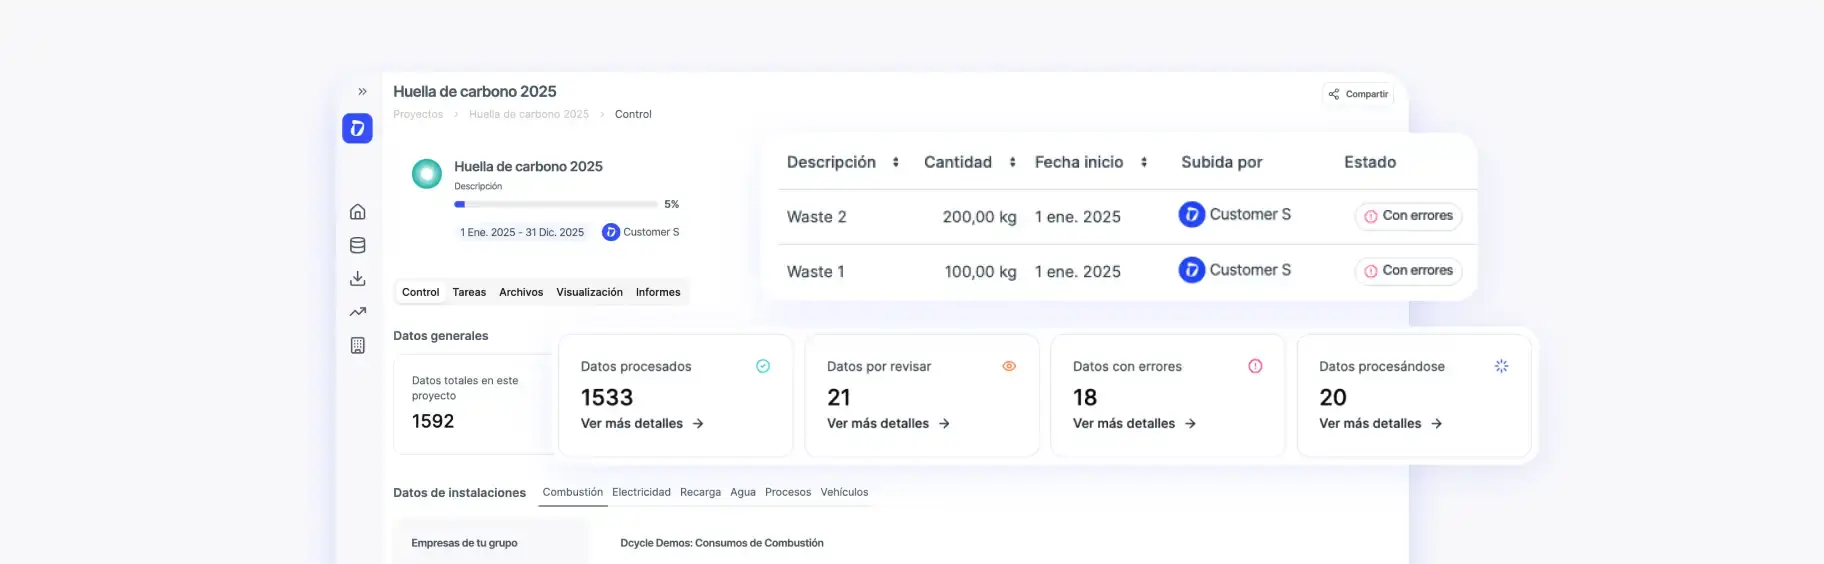
GHG Protocol
Carbon Footprint
Manage data & calculate emissions

GRI
EINF Report
Organize KPIs & create your report
GLEC
Logistics
Manage shipments & calculate emissions
See how it works in your company
ISO 27001 Certified · No commitment required


.png)